
Findings on methane emissions, flaring, and toxic pollution at two oil fields in Kazakhstan, Tengiz and Kokzhide, are the result of research conducted by Omanos Analytics and Crude Accountability from 2019 to 2025. Our study aimed to identify flaring events, calculate the volume of natural gas burned, locate primary emission sources, and analyze emissions of methane, sulfur dioxide (SO2), and nitrogen dioxide (NO2) and their impact on the environment and local communities.
Information on flaring, methane, NO2, and SO2 emissions is either not publicly available in Kazakhstan or significantly fragmented, highlighting a critical lack of transparency and underscoring the importance of Omanos Analytics’ findings in informing civil society about emissions levels in Kazakhstan.
Key Findings
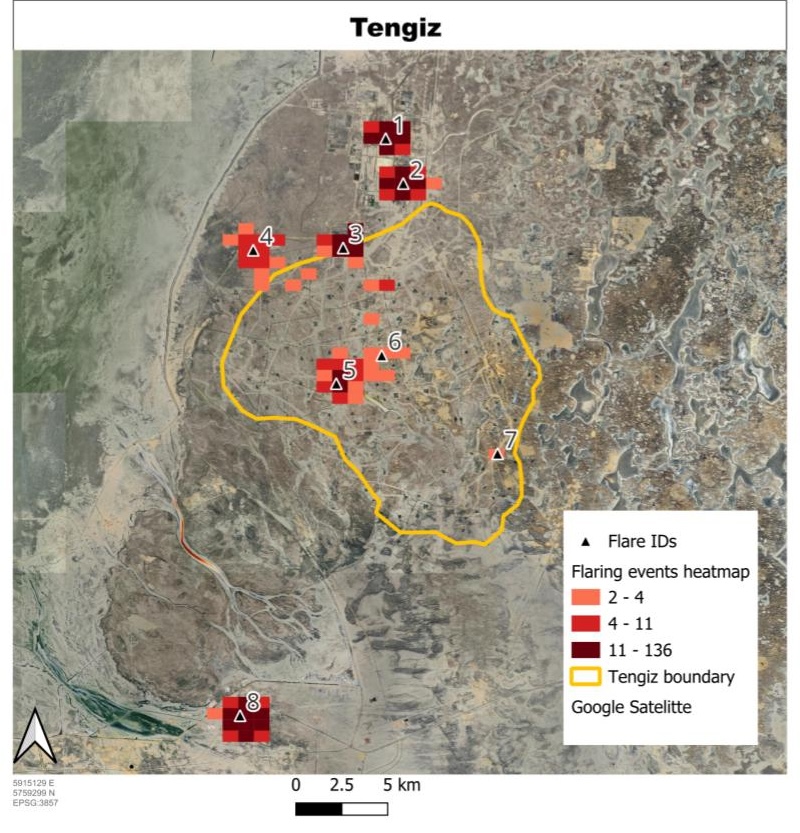
- At the Tengiz oil field, flaring originated from dedicated flaring towers rather than from individual wells. VIIRS Nightfire identified eight separate combustion sources associated with gas flaring.
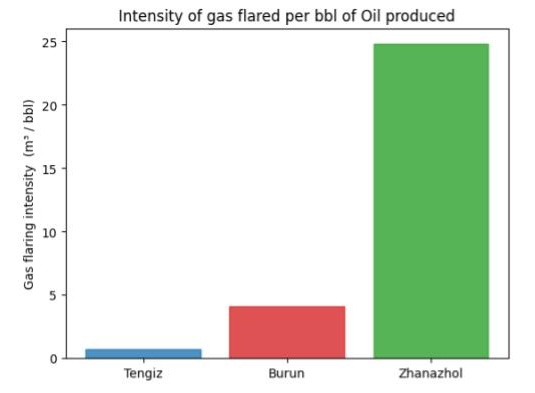
- Flaring intensity at the Tengiz field is below the global average of 5.0 m3/bbl at 0.72 m3/bbl.
- No long-term methane plumes were identified at Tengiz during 2019-2025. No short-term plumes were identified during 2024-2025.
- H2S is removed during processing prior to flaring at Tengiz.
- It appears that NO2 and SO2 emissions increase in the winter months at the Tengiz and Kokzhide oil fields.
- The VIIRS Nightfire combustion source heatmap identified nine gas-flaring locations at the Kokzhide oil field. Some flares are positioned near the wellheads at Kokzhide.
- Kokzhide is characterized by a high flaring intensity of 25 m3/bbl, five times the global average.
- A decrease in flared gas volume since 2012 correlates with a simultaneous drop in oil production.
- NASA-JPL EMIT detected 13 plumes from three distinct emission sources at Kokzhide. Source A emitted at a rate of approximately one ton per hour in 2023 and was dominated by lit tower flaring. Source B is characterized by intermittent small flaring events occurring at different sites at the wellheads. Source C emitted at a rate of 11 tons per hour in 2023 via flaring, venting, and insufficient combustion.
- Crude Accountability conducted ground-truthing at the Tengiz and Kokzhide oil fields and verified flaring of various intensities, including flares visible from at least seven miles’ distance with dense black smoke plumes. Interviews with villagers living near the fields confirmed the regularity of flaring practice at Tengiz and Kokzhide oil fields.
Glossary
- CH4 (Methane): A potent greenhouse gas that accounts for a third of current global warming and is 80% more powerful in raising atmospheric temperatures than CO2 over a 20-year period.
- H2S (Hydrogen Sulfide): A toxic gas found in “sour’ oil and gas reservoirs; it is highly corrosive and toxic to humans in both high and low concentrations.
- NO2 (Nitrogen Dioxide): A byproduct of high-heat combustion (like flaring) that causes ground-level ozone and significant respiratory health issues.
- SO2 (Sulfur Dioxide): A toxic pollutant produced by burning gas containing sulfur; it damages the respiratory tract in humans and contributes to acid rain.
- Sour Gas: Natural gas that contains significant amounts of hydrogen sulfide (H2S).
- Sweeten: The process of “sweetening” involves separating H2S from crude oil to reduce its corrosiveness.
- Flaring: The practice of burning off excess natural gas that is not captured or used during oil production.
- Flaring Intensity: A measure of the volume of gas flared per barrel (bbl) of oil produced.
- Gas Reinjection: A process in which gas is pumped back into the reservoir to maintain pressure and increase oil output.
- Venting: The direct release of unburned natural gas (mostly methane) into the atmosphere.
- Methane Plume: A concentrated “cloud” or leak of methane gas detected by satellite imagery.
- EMIT (Earth Surface Mineral Dust Source Investigation): A NASA-JPL high-resolution sensor used to detect and locate specific methane plumes.
- Sentinel-2: A high-resolution satellite used to identify specific locations of methane emissions and visualize infrastructure.
- Sentinel-5P: An atmospheric scanning satellite used to measure levels of NO2, SO2, and methane column density.
- VIIRS Nightfire: A system using nighttime infrared sensors to detect heat from gas flares, allowing researchers to estimate the volume of gas being burned.
- Kokzhide: An oil field region in Kazakhstan comprising the Kenkiyak, Zhanazhol, and Bashenkol fields.
- Tengiz: One of the world’s largest, deepest, and most complex oil fields, located in western Kazakhstan.
Methodology
The study used two distinct methods to detect flaring at the Tengiz and Kokzhide fields.
One method used nighttime infrared sensors (VIIRS Nightfire) to detect heat from gas flares, enabling estimation of the volume of gas being burned. This was combined with atmospheric scanning (Sentinel-5P) to measure NO2 and SO2 levels.
The second method focused on detecting methane. By combining wide-area satellite monitoring with high-resolution sensors (Sentinel-2 and NASA’s EMIT), researchers identified locations where methane was being emitted.
Together, these tools allow for tracking of both long-term pollution trends and sudden, larger leaks or plumes, providing a transparent way to verify industry claims and identify infrastructure failures.
The method has limitations on cloudy days. By filtering for cloud-free data, the method is unable to capture flaring intensity during cloudy intervals, which may result in data gaps for specific high-cloud months and missed flaring data.
Methane, flaring, NO2, and SO2
Methane accounts for a third of current global warming and is 80% more potent as a greenhouse gas than carbon dioxide (CO2) at warming the planet over a 20-year period after its release. Therefore, it is critical to address methane emissions to immediately mitigate the climate crisis.
Thirty-five percent of the world’s methane emissions originate from fossil fuels. Gas flaring and venting are major contributors to methane emissions in Kazakhstan and worldwide. In addition to methane emissions, burning excess natural gas in oil fields produces toxic pollutants such as NO2 and SO2, which also contribute to global warming. Thus, reducing gas flaring and methane emissions will provide significant local health benefits alongside climate benefits.
NO2 and SO2 are byproducts of high-heat combustion, such as flaring natural gas. NO2 is known for causing ground-level ozone, a major driver of premature mortality, and which is responsible for hundreds of thousands of deaths annually, cardiovascular disease, and millions of asthma-related emergency room visits globally.
SO2 damages the upper respiratory tract in humans and contributes to the formation of acid rain. Long-term exposure to SO2 increases mortality rates, especially among those with cardiac and lung diseases.
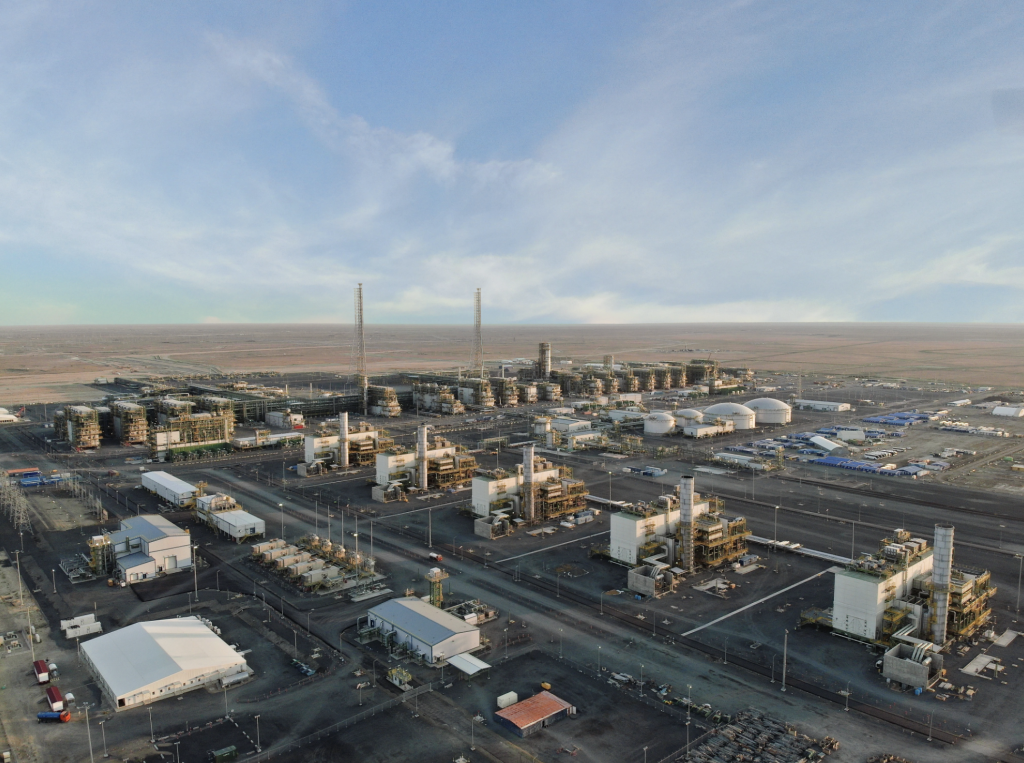
Tengiz
The Tengiz field, one of the largest oil fields in the world, is located in Atyrau Oblast in western Kazakhstan and is operated by Tengizchevroil (TCO), a consortium comprised of Chevron (50%), ExxonMobil (25%), KazMunayGaz (20%), and LukAcro (5%). Tengiz contributes significantly to the Kazakhstani economy, accounting for almost 10% of the country’s GDP.
Tengiz is one of the world’s deepest and most complex oil fields due to its high sulfur content. The field produces sour gas with a reported hydrogen sulfide (H2S)1 level of 15–17%. Tengiz’s facilities are designed to ‘sweeten’ crude oil by separating H2S and natural gas from it.
As part of a recently launched $48 billion expansion project at Tengiz—known as the “Future Growth Project”—facilities are capable of reinjecting sour gas to bolster reservoir pressure and ramp up output to 1 million barrels of oil per day increasing oil production by 260,000 barrels per day at full capacity, highlighting the extensive nature of the oil field and its impact on humans and the environment.
TCO claims a 96% reduction in flaring since 2000 and 76% reduction in emission intensity.
Flaring
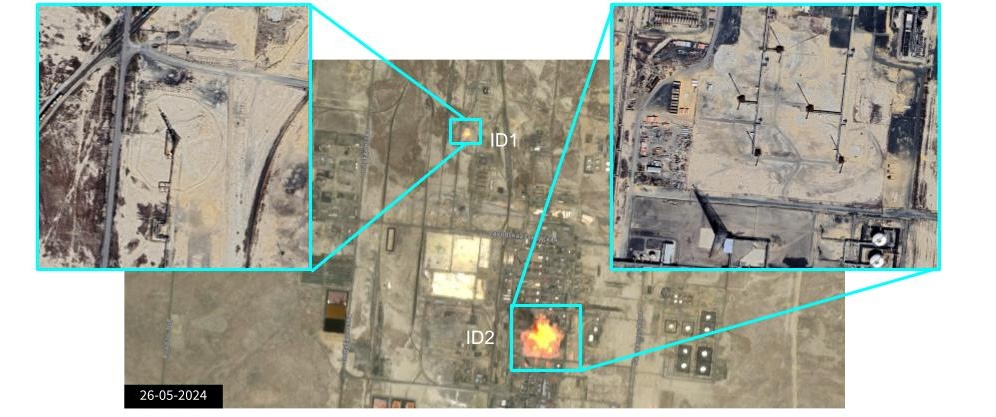
According to the Omanos Analytics’ analysis, satellite data from the VIIRS Nightfire combustion source sensor revealed eight separate combustion sources associated with gas flaring at the Tengiz field.2 High-resolution satellite analysis (60–80 cm) confirmed that flaring originated specifically from dedicated flaring towers rather than individual wells.


Tengiz’s flaring intensity (Figure 7), which measures gas flared per barrel (bbl) of oil produced, remains below the global average of 5.0 m3/bbl,3 at 0.72 m3/bbl, which, according to Omanos Analytics, supports Tengiz’s reported excess gas utilization rate of 99.5% for 2023. Between 2012 and 2024, annual flared gas volumes remained consistent, varying by less than 0.2 billion cubic meters (BCM) throughout the period, with only a slight decrease observed in 2018 (Figure 8).

The Tengiz oil facilities have consistently relied on flaring, while simultaneously claiming a significant reduction in the practice. However, differentiating between routine and emergency flaring remains a challenge without access to TCO’s specific emergency logs. Further investigation is necessary to clarify these operational patterns and verify that the Tengiz oil field is in compliance with the Kazakhstani law banning routine flaring. While analysis indicates that flaring intensity is below the global average, the lack of transparent data leaves Crude Accountability concerned about whether total emission volumes are safe for nearby and downwind communities given the field’s vast production scale.

Methane
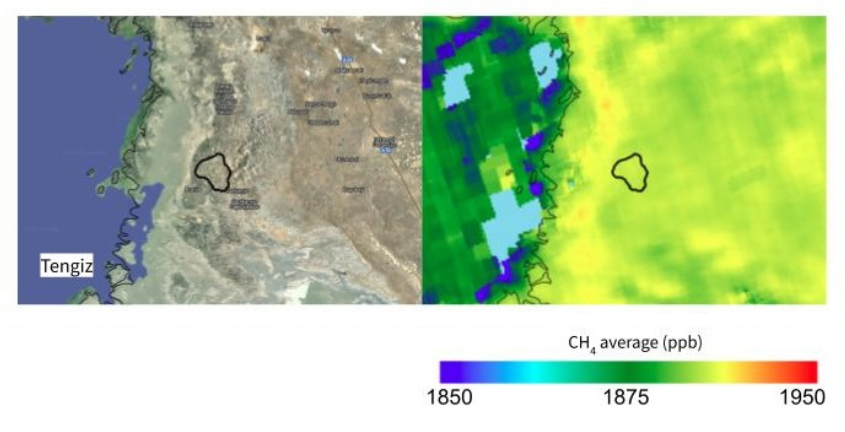
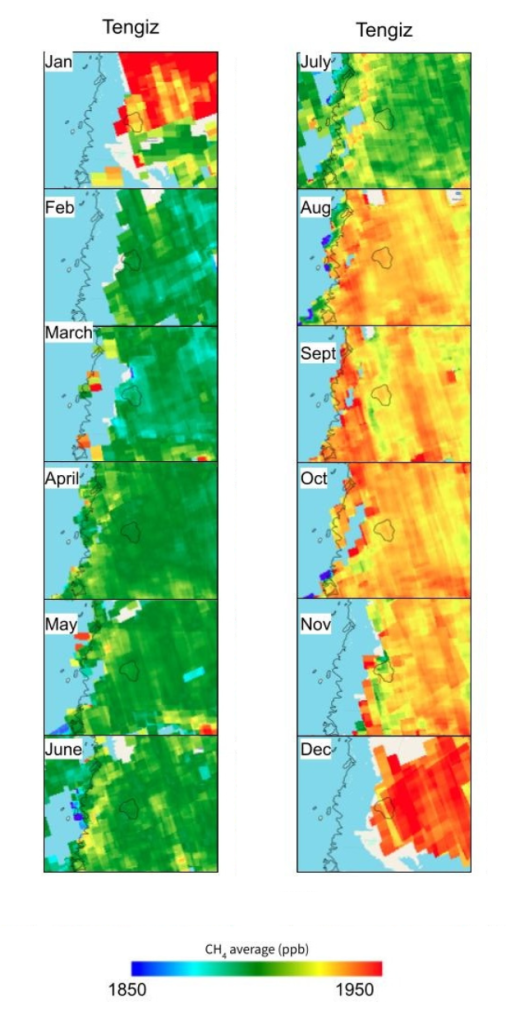
Long-term analysis (2019–2025) by Omanos Analytics, using annual and monthly averaging of methane column density, identified no long-term methane leaks at Tengiz, also known as methane plumes. Sentinel-5P’s daily analysis for the same period found no evidence of short-term transient leaks.
High-resolution Sentinel-2 imagery from 2024–2025—covering approximately seven cloud-free days per month—detected no methane plumes over Tengiz. Additionally, data processed by Carbon Mapper showed no methane plumes detected at the site.
NO2 and SO2
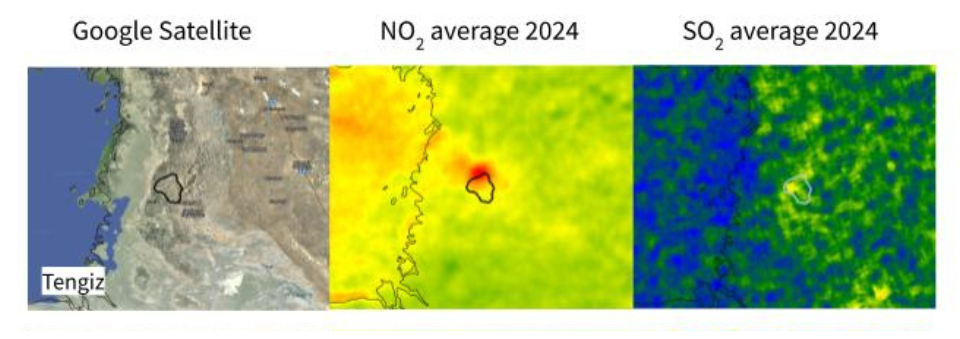
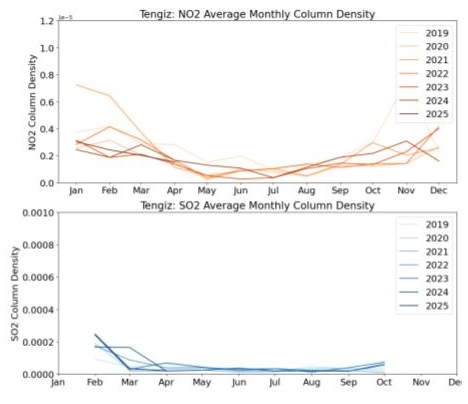
According to the analysis of NO2 and SO2 correlation, H2S is removed during processing prior to flaring, rather than the gas being flared in its raw state.
Although SO2 emissions at Tengiz are comparable to those of much smaller fields like Burun in Turkmenistan, Tengiz has a significantly higher oil production rate and a higher concentration of sour gas. Despite that, further investigation of the correlation of NO2 and SO2 levels with maximum permissible concentrations (MPC) is needed.
Kokzhide
The Kokzhide oil field consists of Kenkiyak, Zhanazhol, and Bashenkol oil fields, which are operated by China National Petroleum Corporation (CNPC, China), KMK Munai (China), Ada Oil (South Korea), Kazakhoil Aktobe (Kazakhstan), and Urikhtau Operating (Kazakhstan). Kenkiyak and Zhanazhol have been in production since 1987 and 1976, respectively. The fields are located in Aktobe Oblast.
These fields produce sour gas with H2S concentrations ranging from 2% to 6%, significantly lower than levels at the Tengiz field.
Due to documented consistent contamination of the freshwater aquifer overlying the oil reservoir, the government has mandated a phased decommissioning of wells by 2031. However, as of the issuing of this report, only four wells have been fully decommissioned, and the overall process has been significantly delayed. Environmental defenders have filed a lawsuit against Kazakhstan’s Ministry of Ecology and Natural Resources for violating their right to access information regarding a critical hydrological and hydrogeological study of Kokzhide. The study will define the future of the sands and the aquifer–either the decommissioning of oil wells to protect the aquifer or the continuation of devastating oil extraction.
Flaring
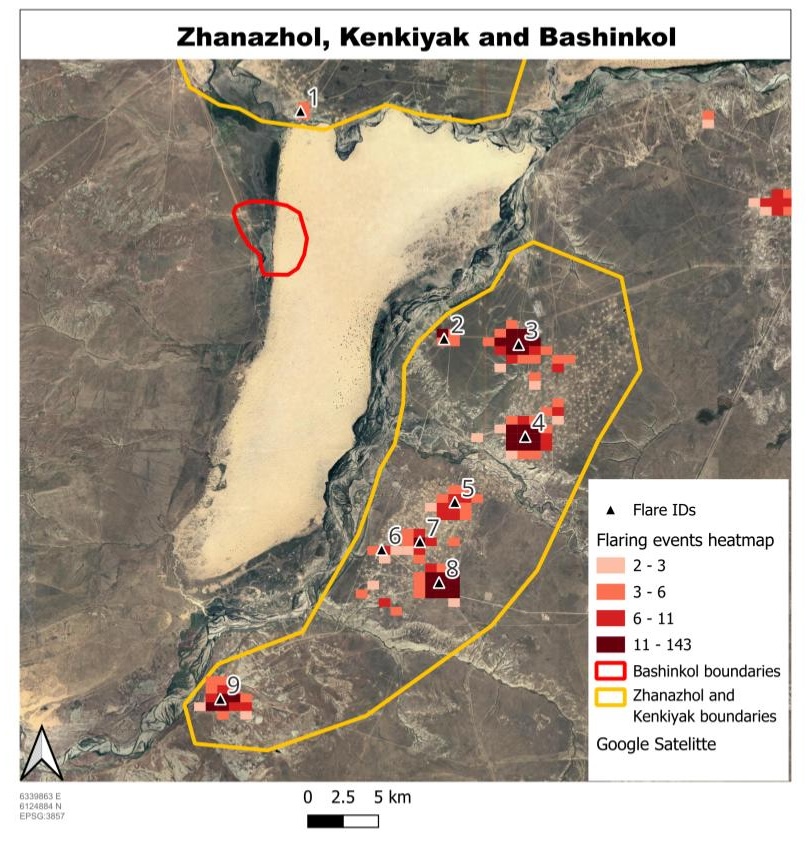
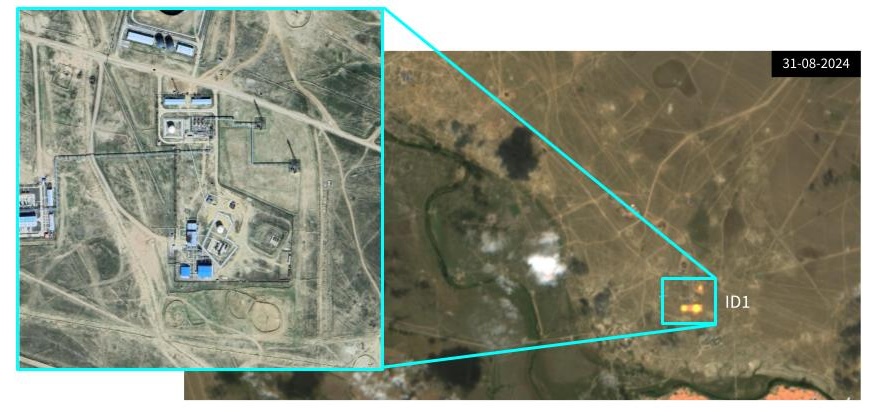
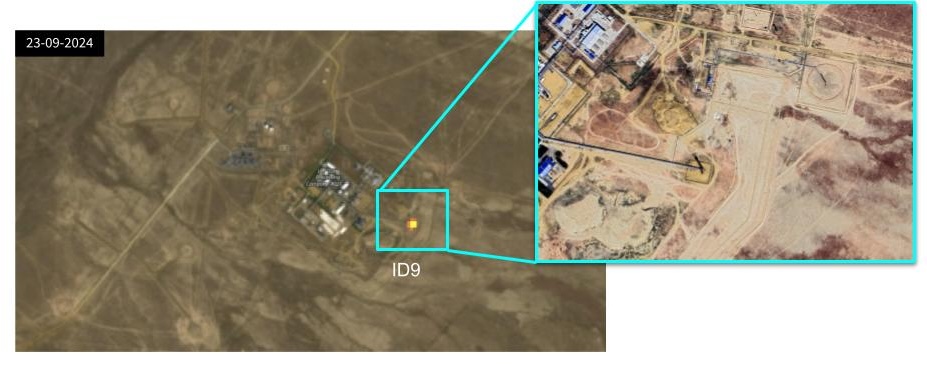
According to data sourced by Omanos Analytics, the VIIRS Nightfire combustion source heatmap of the Kokzhide oil and gas fields showed nine gas-flaring locations, with one in Kenkiyak and eight in Zhanazhol.4
The flares are located away from the gas processing facilities. Some flares are positioned near wellheads, which suggests that flaring occurs shortly after hydrocarbons reach the surface.


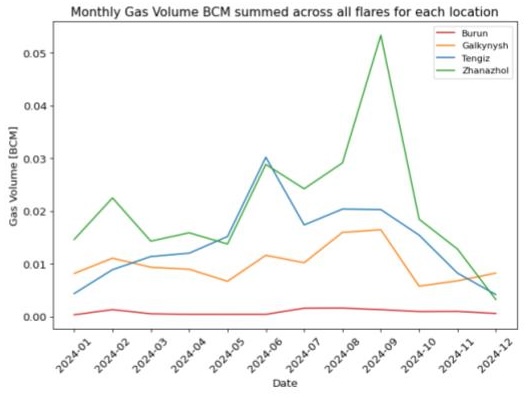
Using the VIIRS Nightfire satellite data, Omanos Analytics calculated the monthly gas flaring volumes for each identified flare source, and compared the total gas volume in 2024—measured in BCM—across all flares to other major sites: the Tengiz field and two fields in Turkmenistan, the Burun oil field and the Galkynysh natural gas field (see Figure 6).

The flare intensity calculation (see Figure 8), which measures bbl of oil produced, indicates a high level at Zhanazhol. Zhanazhol oil field produced 10 million bbl as of 2020, with a flaring intensity of 25 m3/bbl, five times the global average. High flaring intensity is likely due to a lack of infrastructure to utilize or “sweeten” sour gas, resulting in the gas being flared rather than reinjected.
Flared gas volume at Zhanazhol was at its highest levels in 2015 (see Figure 7), but dropped significantly between 2012 and 2024, from 1.6 BCM in 2015 to 0.3 BCM in 2024. This trend aligns with the decline in oil production: output was 5 million tons in 2014,5 but dropped to approximately 3.0 million tons in 2020 and 2.5 million tons in 2025.
Oil companies’ reports on the site’s sour gas processing capabilities are contradictory. The KAZENERGY report from 2023 states that the site cannot “sweeten” sour gas, while the CNPC report suggests that the Zhanazhol plant can process it.


Methane

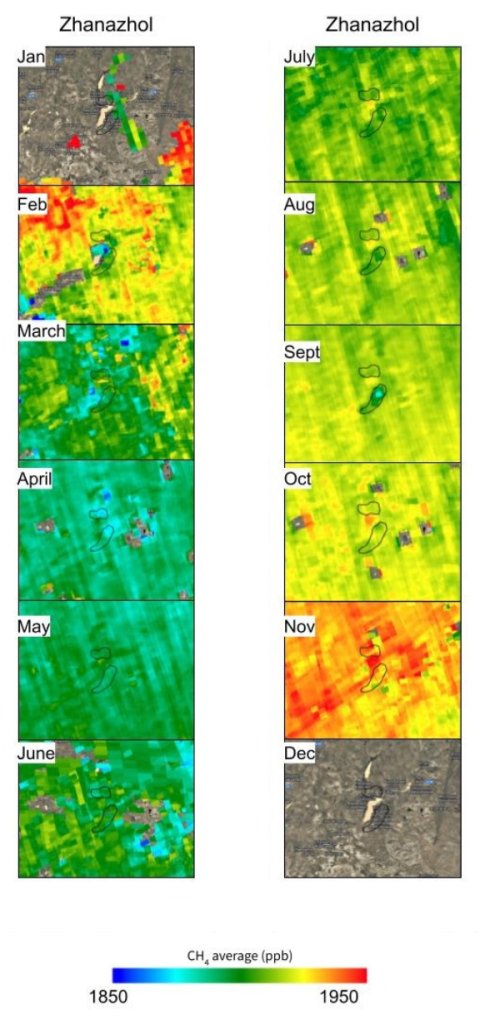
NASA-JPL EMIT Detected 13 Plumes from Three Distinct Emission Sources at Zhanazhol
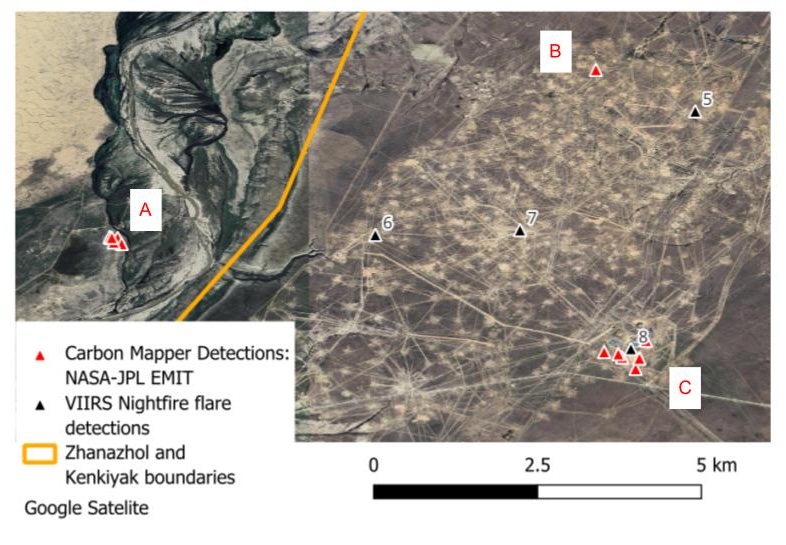
Figure 25 displays detected emission sources—labeled A, B, and C—alongside gas flare locations identified via VIIRS Nightfire (see Figure 13). Each emission source is located near gas flaring infrastructure. According to Omanos Analytics’ study, this spatial relationship suggests that the emissions originate from venting in unlit flares or from incomplete combustion in lit flares, allowing unburned methane to escape.
Emission Source A
Emission source A emitted approximately 0.007 BCM of methane in 2023. This corresponds to an hourly emission rate of approximately 1 ton per hour. Methane emissions from source A are likely dominated by lit tower flaring, with one possible instance of gas emission when the flare tower was unlit.
Emission Source B
The source B flaring hotspot is caused by intermittent small flaring events occurring at different sites near wellheads. Because these flares happen across a wide area, they appear as a single hotspot in the data.
Emission Source C
Emission source C emitted approximately 0.126 BCM of gas in 2023, which corresponds to an estimated hourly flaring volume of approximately 11 tons per hour. Flaring, venting, and/or inefficient combustion occur at this emission source intermittently within several potential scenarios:
- Gas flow through the flare is temporarily increased.
- Combustion efficiency is reduced due to wind or atmospheric conditions.
- Occurrence of intermittent periods of unlit flaring.
- In addition to the main lit tower, there are emissions from the nearby flare tower, which operates under different conditions.
Although other analyzed flaring hotspots emit as much gas as the hotspot ID 8 (emission source C) identified by VIIRS Nightfire, only the tower at hotspot ID 8 (emission source C) is observed to cause methane plumes. This indicates that the methane plumes may be due to poor performance of the flare tower at emission source C, resulting in unstable flaring with intermittent periods of unlit flaring, or poor flaring efficiency.
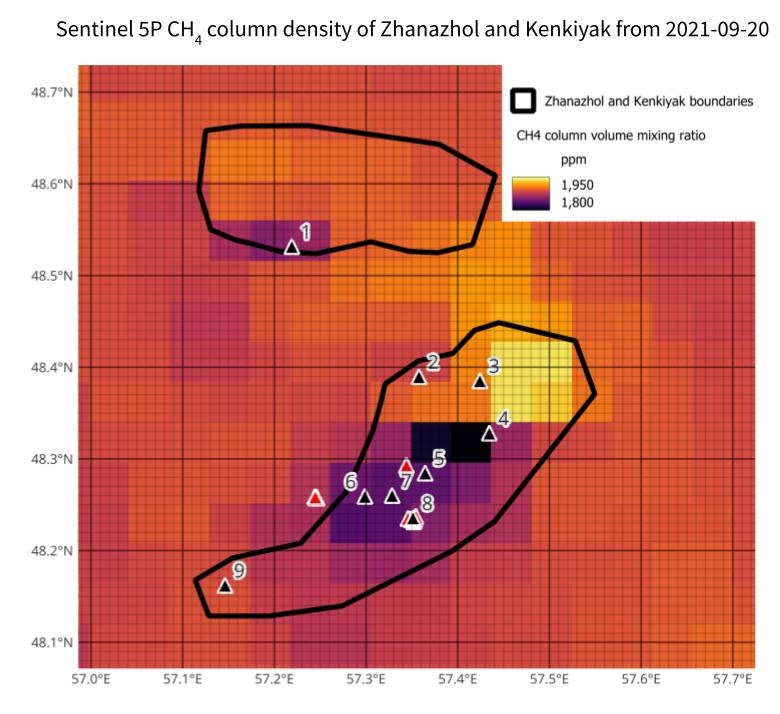
The 2021 Plume
On September 20, 2021, Sentinel-5P detected a methane plume originating from the Zhanazhol field boundary. This event was also identified by Kayrros, a methane-tracking platform that utilizes Sentinel-5P data. The emission rate for the plume was estimated at 13 tons per hour.

NO2 and SO2

The SO2 and NO2 emissions increase in the winter months at Kokzhde. This can be attributed to meteorological conditions, in which colder, drier air traps pollutants, leading to a buildup, and increased fuel use for heating during these months.

SO2 emissions from Zhanazhol are comparable to those from the Tengiz field, despite Zhanazhol having lower oil production and H2S levels.
- H2S is a highly toxic, flammable, and corrosive gas that poses significant risks to infrastructure and aquatic ecosystems. H2S is highly lethal; even brief exposure to high concentrations can cause immediate collapse and death. Survivors of high-dose exposure often suffer from permanent neurological symptoms, including memory loss and impaired motor function. It behaves similarly to cyanide. It binds to iron in the mitochondrial cytochrome enzymes, effectively suffocating the body at a cellular level (NCBI). ↩︎
- Omanos Analytics (2025), Flared gas volumes at fossil fuel production sites in Kazakhstan and Turkmenistan. ↩︎
- Cubic meter per barrel ↩︎
- Omanos Analytics (2025), Flared gas volumes at fossil fuel production sites in Kazakhstan and Turkmenistan. ↩︎
- https://s3-prod.exia.kz/articles/NationalReport15-Russian.pdf p. 144 ↩︎