
27 April 2026
By Dr. Gubad Ibadoghlu, Visiting Senior Fellow at London School of Economics and Political Science (LSE)
Introduction
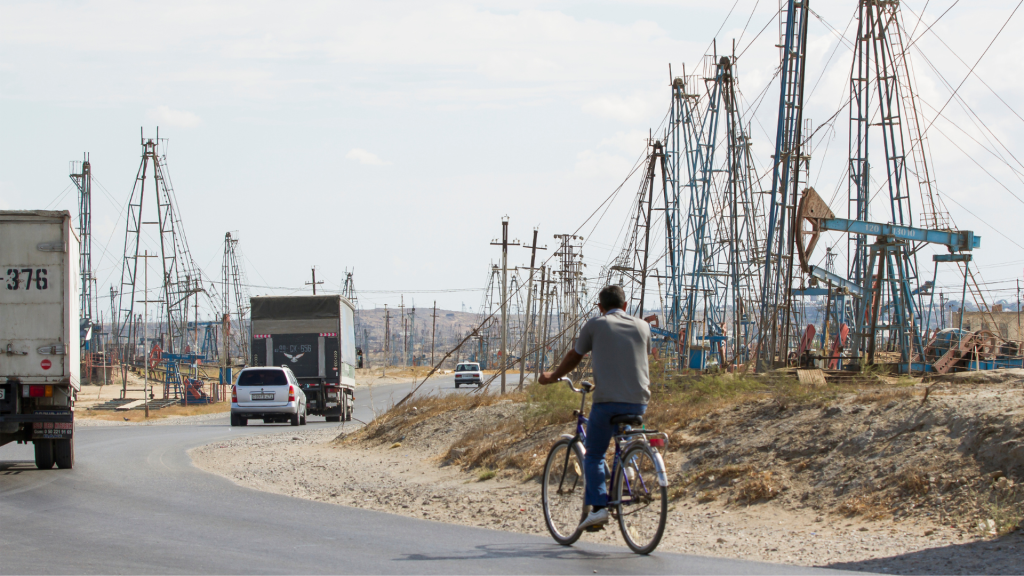
Having regained its independence in 1991, over the past three decades Azerbaijan has positioned the fossil fuel sector at the core of its economic strategy. This orientation was institutionalized when it signed a 30-year production-sharing agreement for the development of a major offshore oil field, to be exploited jointly with foreign companies beginning in the mid-1990s. As a result, the extractive industries have played a central role in attracting foreign direct investment and shaping Azerbaijan’s macroeconomic trajectory. There is little doubt that the principal driver of the country’s economic performance over this period has been revenues derived from oil and gas exports. However, recent developments indicate a structural shift: declining oil production has led to a reduction in revenues, and increasing natural gas output has thus far proven insufficient to fully compensate for these losses.
At the same time, persistent structural constraints continue to hinder economic transformation. The failure to transition to a fully functioning market economy, due to the legacy of centralized economic management, entrenched monopolistic practices, and systemic corruption poses significant obstacles to modernization, liberalization, and diversification. The consequences are increasingly evident: economic growth has decelerated, previously optimistic projections have not materialized, and investment in socio-economic development, human capital, and environmental sustainability has declined. These trends are accompanied by a broader stagnation in institutional development, including significant setbacks in democratic governance and civil liberties.
Against this background, this article provides both a retrospective assessment of Azerbaijan’s economic development and a forward-looking analysis of the challenges likely to shape its trajectory in the coming decades. To more accurately evaluate current conditions and identify emerging trends, the study adopts a comparative perspective, drawing on forecasts from leading international organizations. Azerbaijan’s performance is examined alongside that of neighboring and structurally relevant economies, including resource-rich Kazakhstan, resource-poor Armenia, and the Republic of Georgia. This comparative framework allows for a more nuanced understanding of Azerbaijan’s relative development trajectory and structural constraints. Finally, the article engages with the concept of the middle-income trap, assessing the extent to which Azerbaijan faces the risk of prolonged stagnation at intermediate levels of income and development.
Three Decades of Growth Cycles in Azerbaijan
Examining Azerbaijan’s main economic parameters over the three decades following the transformation crisis (1992–1995) reveals the pronounced impact of oil-export and revenue dynamicson macroeconomic performance.
On September 20, 1994, Azerbaijan signed a Production Sharing Agreement (PSA) with foreign companies for the development of the Azeri-Chirag-Guneshli (ACG) oil fields in the Caspian Sea. This agreement holds a significant place in Azerbaijan’s history, shaping the nation’s economy and garnering respect and appreciation. The PSA—initially set for 30 years—was extended on September 14, 2017, until the end of 2049, commencing the second phase of this contract.
Within the framework of the ACG development project, Azerbaijan generated cumulative net profits exceeding USD 176.3 billion over the period from 2001 to January 1, 2025. This income played a significant role in shaping the state financial system, particularly SOFAZ and the state budget. During the 25 years of the Fund’s operation, its revenues amounted to USD 202.1 billion, of which USD 189 billion derived from oil and gas contracts. Since its inception through 2024 SOFAZ has generated a USD 15 billion gain in absolute terms, equivalent to an annualized return of 2.6%. Through transfers of USD 128.9 billion to the state budget, the Fund achieved financial balance and financed important projects.
In line with fluctuations in the volume of oil production and exports, Azerbaijan’s economic growth indicators have exhibited corresponding changes. These dynamics were linked to large-scale capital inflows associated with the development of the first two phases of ACG, construction of the Sangachal Terminal for export operations, and the Baku-Tbilisi-Ceyhan (BTC) pipeline as the main export route to points west.
These developments were reflected in macroeconomic performance. In the first decade following independence, Azerbaijan’s GDP contracted at an average annual rate of 6.3% between 1990 and 2000. This period of decline was followed by a phase of rapid expansion, with GDP growing at an average annual rate of 12.7% between 2000 and 2005, driven largely by rising oil production and export revenues.1 Between 2006 and 2015, GDP grew by nearly 9.5% annually on average, driven by energy exports. Yet reliance on hydrocarbons has generated structural fragilities. Declining production, volatility in global oil markets, and weak diversification expose Azerbaijan to mounting risks. Growth has slowed dramatically since 2016, reflecting both declining energy output and weak diversification. Accordingly, we delineate three subperiods—pre-oil boom, oil boom, and post-oil boom—and report the corresponding indicators in Table 1.
Table 1. Macroeconomic Indicators by Period (1996–2025)
| Period | Avg. GDP Growth (%) | GDP (mln USD) | GDP per capita (USD) | Inflation (%) | Foreign Direct Investment inflows (% of GDP) |
| 1996–2005 (pre-oil boom) | 10.23 | 6,258.3 | 772.7 | 3.89 | 27.45 |
| 2006–2015 (oil boom) | 9.49 | 53,812.4 | 5,926.6 | 6.98 | 8.77 |
| 2016–2025 (post-oil boom) | 1.46 | 57,644.2 | 5,730.4 | 7.02 | 2.00 |
As shown in Table 1, the highest average annual GDP growth occurred in the pre-oil boom decade. Between 1996 and 2005, national income expanded by an average of 10.23% per year. The principal driver was exceptionally large foreign direct investment (FDI) inflows, which averaged 27.45% of GDP—roughly four times the share recorded during the subsequent oil-boom decade and more than fourteen times the share in the most recent decade.
Concurrently, significant progress was made in the transition to a market economy: private entrepreneurship expanded, monetary and fiscal balances improved, and budget discipline was strengthened.
During the oil-boom decade, foreign investment continued to flow into Azerbaijan; however, despite strong GDP growth, the FDI share averaged only 8.77% of GDP. Although the period was officially presented as the completion of the market-transition agenda, in practice governance, privatization, and liberalization reforms remained incomplete. The expanded role of state-owned enterprises further entrenched state dominance and fueled the growth of the shadow economy.
In the post–oil-boom period, which followed the devaluation of the Azerbaijani manat,2 the government adopted numerous reform-oriented economic and social programs. Yet implementation was weak, producing limited progress on economic diversification while monopolization and corruption intensified. At the same time, declining oil production and lower investment contributed to a fall in the average annual GDP growth rate. Pandemic-related restrictions compounded these problems: since March 2020, land and sea borders have remained closed, creating serious impediments to cross-border trade and constraining the economic development of border regions of the country.
Table 2 presents medium-term growth projections for Azerbaijan—covering 2025-2027—compiled from documentation from international financial institutions, credit-rating and analytical agencies, and official government forecasts. Taken together, these projections indicate that the economy is entering a period of deceleration.
Table 2. Medium-term economic growth projections in Azerbaijan, (%)
| 2025 | 2026 | 2027 | |
| World Bank | 2.6 | 2.4 | 2.3 |
| The International Monetary Fund | 3.0 | 2.1 | 2.5 |
| The European Bank for Reconstruction and Development | 3.0 | 2.5 | n/a |
| The Asian Development Bank | 2.4 | 2.0 | n/a |
| Moody’s | 1.5 | 3.0 | 2.5 |
| S&P Global | 1.8 | 2.0 | 2.0 |
| Fitch Solutions | 2.6 | 2.4 | 2.3 |
| ING Group | 2.3 | 2.5 | 2.0 |
| The Economist | 2.9 | 2.9 | 3.1 |
| Azerbaijan’s Ministry of Economy | 3.5 | 2.8 | 3.8 |
Table 2 indicates that ING has revised its 2025 GDP growth forecast for Azerbaijan from 2.5% to 2.3%; it keeps 2026 at 2.5% and sets 2027 at 2.0%. The Ministry of Economy of Azerbaijan projects comparatively higher growth of 3.5% (2025), 2.8% (2026), and 3.8% (2027). Among rating agencies, S&P Global expects 1.8- 2.0% in 2025–2026, Fitch Ratings forecasts 3.0% (2025) and 2.4% (2026), and Moody’s anticipates 2.5% annually.
International financial institutions are broadly aligned on moderation: the IMF projects 2.1% (2025) and 2.5% (2026); the EBRD sees 3.0% (2025) and 2.5% (2026); the ADB estimates 2.4% and 2.0% over the next two years; and the World Bank’s April and June 2025 updates projected real GDP growth for Azerbaijan of 2.6% in 2025 and 2.4% in 2026. In its 8 October 2025 release, the Bank lowered these forecasts to 1.9% (2025), 1.8% (2026), and 1.7% (2027). The IMF likewise revised its outlook in the 2025 October World Economic Outlook, cutting the 2025 projection by 0.5 percentage points—from 3.0% to 2.5%—and signaling a weaker profile for 2026.
The actual level of real GDP growth in 2025 demonstrated that both the domestic government and international organizations and agencies had made overly optimistic forecasts regarding economic growth in Azerbaijan, none of which was fully realized. Thus, GDP growth is likely to slow to 1.4% in 2025, down from 4.1% in 2024. SSCA data indicate a 1.6% decline in the oil and gas sector and 2.7% growth in the non-oil and gas sector. Despite this, the Ministry of Economy forecasts GDP to grow by 3.5% in 2025. The deviation from the 2025 forecasts increases uncertainty regarding projections for the current and the following year.
Azerbaijan’s Growth Slowdown and the Risk of the Middle-Income Trap
The current state of the Azerbaijani economy, and its medium- and long-term growth prospects, appear increasingly pessimistic. The World Bank suggests that, in the absence of fundamental structural changes and comprehensive reforms, economic performance is likely to deteriorate further.
Consistent with these short- to medium-term signals, the World Bank’s Long-Term Growth Model (LTGM) presents an even more sobering outlook. Under a baseline scenario without significant reform, average annual GDP growth is projected to decline to approximately 0.5% over the period 2024–2050, with GDP per capita increasing by only around 11% over the next three decades.
Table 3 summarizes the LTGM projections for Azerbaijan over 2024–2050.
Table 3. World Bank LTGM projections for Azerbaijan, 2024–2050, (%)
| Average Growth Rate | 2024-2050 | 2024-2029 | 2030s | 2040s |
| I. Total GDP | 0.5 | 1.1 | 0.5 | 0.1 |
| II. Non-Energy GDP | 1.6 | 2.0 | 1.8 | 1.3 |
| III. Energy GDP (Oil + Gas) | -2.3 | -0.2 | -2.2 | -3.5 |
As shown in the table derived from the World Bank’s LTGM, the Azerbaijani economy may enter a phase of stagnation or even decline over the next two decades. In particular, if current demographic trends persist, GDP per capita could stagnate or potentially decrease during this period. The principal factor underlying these adverse medium- to long-term prospects is the accelerating average annual decline in energy-related GDP. The limited capacity of the non-energy sector to offset these losses—especially over the next 20 years—further highlights the structural vulnerabilities of the economy and contributes to an increasingly pessimistic outlook.
Importantly, this unfavorable trajectory is not only reflected in projections by the World Bank but is also evident in forecasts produced by other reputable international analytical centers, as well as in comparative assessments with neighboring economies such as Armenia, Georgia, and Kazakhstan. In this context, a recent report published by the UK-based Centre for Economics and Business Research (CEBR), titled World Economic League Table, provides long-term forecasts for 190 countries through 2040. Using 2025 as the base year, the report presents projections for GDP growth, GDP at current prices, and GDP per capita over the period 2010–2040. The estimated 3 selected indicators provided by the CEBR—including constant price GDP (relative to the base year, %), GDP at current prices (USD bn), and GDP per capita (USD)—for the four aforementioned countries are presented in Tables 4–6.
Table 4. Constant Price GDP (relative to base year, %)
| Year | Azerbaijan | Georgia | Armenia | Kazakhstan |
| 2010 | -24% | -57% | -50% | -43% |
| 2015 | -14% | -44% | -38% | -28% |
| 2020 | -17% | -36% | -30% | -20% |
| 2024 | -3% | -7% | -5% | -6% |
| 2025 | – | – | – | – |
| 2026 | 2% | 5% | 5% | 5% |
| 2030 | 13% | 29% | 27% | 20% |
| 2035 | 27% | 66% | 56% | 42% |
| 2040 | 43% | 113% | 89% | 68% |
As shown in Table 4, relative to the 2025 baseline, Georgia exhibits the lowest initial level of constant price GDP, followed by Armenia, Kazakhstan, and Azerbaijan. This indicates that Azerbaijan begins from the most favorable relative starting position. However, despite this advantage, Azerbaijan is projected to record the lowest growth rates in constant price GDP in the post-2025 period. Under alternative conditions—had earlier growth dynamics been sustained—the Azerbaijani economy could have maintained its regional leadership. Nevertheless, projections suggest that over the next 15 years, Georgia’s higher growth trajectory will allow it to surpass Azerbaijan in relative terms, while both resource-poor Armenia and resource-rich Kazakhstan are also expected to outperform Azerbaijan.
The dynamics of GDP at current prices (USD bn), in absolute terms, for all four countries—covering both the retrospective period (2010–2025) and the prospective period (2025–2040)—are presented in Table 5.
Table 5. Current Price GDP (USD bn)
| Year | Azerbaijan | Georgia | Armenia | Kazakhstan |
| 2010 | 53 | 12 | 9 | 148 |
| 2015 | 53 | 15 | 11 | 184 |
| 2020 | 43 | 16 | 13 | 171 |
| 2024 | 74 | 34 | 26 | 291 |
| 2025 | 76 | 38 | 28 | 303 |
| 2026 | 81 | 41 | 31 | 337 |
| 2030 | 100 | 53 | 41 | 411 |
| 2035 | 123 | 72 | 52 | 503 |
| 2040 | 152 | 102 | 69 | 650 |
As indicated in Table 5, Kazakhstan maintains its position as the regional leader in terms of GDP at current prices throughout the entire period, exhibiting approximately a 4.4-fold increase between 2010 and 2040. Over the same period, GDP grows by around 2.8 times in Azerbaijan, 8.5 times in Georgia, and 7.6 times in Armenia. Notably, the highest growth rates are observed in the resource-poor economies of Georgia and Armenia, while comparatively lower growth is projected for the resource-rich economies of Kazakhstan and Azerbaijan.
Considering GDP at current prices (USD bn) in absolute terms and projected population growth, a cross-country comparison of GDP per capita (USD), as estimated by the CEBR, is presented in Table 6.
Table 6. GDP per Capita (USD)
| Year | Azerbaijan | Georgia | Armenia | Kazakhstan |
| 2010 | 5,881 | 3,270 | 3,066 | 9,070 |
| 2015 | 5,525 | 4,090 | 3,527 | 10,511 |
| 2020 | 4,280 | 4,308 | 4,268 | 9,122 |
| 2024 | 7,251 | 9,141 | 8,330 | 14,459 |
| 2025 | 7,365 | 10,181 | 9,113 | 14,890 |
| 2026 | 7,724 | 11,151 | 9,989 | 16,378 |
| 2030 | 9,120 | 14,409 | 13,282 | 19,151 |
| 2035 | 10,732 | 19,734 | 17,614 | 22,223 |
| 2040 | 12,634 | 27,856 | 23,905 | 27,243 |
The data in Table 6 indicate that, in 2010, the highest initial levels of GDP per capita were observed in Kazakhstan and Azerbaijan, while Georgia and Armenia started from comparatively lower positions. However, according to CEBR projections, by 2040 GDP per capita is expected to increase approximately 2.15 times in Azerbaijan, 3 times in Kazakhstan, 8 times in Armenia, and 8.5 times in Georgia. Although Azerbaijan initially outperformed both Armenia and Georgia in 2010 and 2015—and remained at a similar level in 2020—it is projected to lose its relative position in subsequent years. By the end of the period, Azerbaijan is expected to lag behind all comparator countries. Specifically, by 2040, Azerbaijan’s GDP per capita is projected to be approximately 2.2 times lower than that of Georgia, 2.15 times lower than Kazakhstan, and about 1.9 times lower than Armenia.
The downward trajectory of the Azerbaijani economy, its weakening economic position relative to neighboring countries, the deceleration of growth rates, and the prospect of future stagnation suggest that the country is likely to remain within the upper-middle-income category rather than advancing further along the development ladder. In contrast, Georgia, Kazakhstan, and Armenia are projected to transition into the high-income group of countries.
According to a report by Oliver Wyman, a Marsh McLennan business, titled “Azerbaijan 3.0: The Market Makers of Tomorrow by 2035,” the country is projected to undergo a significant structural transformation. Beyond baseline GDP growth, this transformation is expected to result in an economy valued at approximately USD 150 billion by 2035, accompanied by a reconfiguration of sectoral contributions.
The report anticipates that the industrial sector, including construction, will account for approximately 26% of GDP (around USD 39 billion), driven by downstream industrialization and the development of integrated value chains in petrochemicals, materials, and advanced processing. The manufacturing sector is projected to contribute about 10% (USD 15 billion), while agriculture is expected to comprise roughly 4% (nearly USD 6 billion). A substantial share of growth is also attributed to the services sector, particularly tourism.
However, this projection appears to overestimate the growth potential of the service sector, especially tourism, given existing structural constraints and institutional limitations. In this regard, the assumption that Azerbaijan could reach a USD 150 billion GDP by 2035 may be overly optimistic. Notably, this target is advanced by approximately five years compared to projections by the CEBR, raising questions about the underlying assumptions and methodological differences between the forecasts.
Taken together, these dynamics point to the Azerbaijani economy’s increasing exposure to the so-called middle-income trap. The middle-income trap refers to a situation in which a country, having reached a certain level of income, experiences a prolonged slowdown in growth and fails to transition to a high-income economy due to structural constraints, limited innovation capacity, and insufficient productivity gains.3
According to the World Bank’s recent report on accelerating economic growth through entrepreneurship, technological adoption, and innovation, under current structural and policy conditions, Azerbaijan is projected to require approximately 100 years to attain high-income country status (USD 13,935 in 2025 FY). In contrast, Georgia and Armenia are expected to reach this threshold within 30 and 20 years, respectively. For Kazakhstan, the transition is estimated at just over 30 years, while Turkmenistan may achieve this status in under 30 years. Among the 16 countries assessed across Eastern Europe, the South Caucasus, and Central Asia, Azerbaijan ranks among the bottom three, alongside Tajikistan and Uzbekistan, indicating significant challenges in convergence with high-income economies. However, the Socio-Economic Development Strategy of the Republic of Azerbaijan for 2022–2026, adopted on July 22, 2022, articulates an ambitious goal of elevating Azerbaijan to the status of a high-income economy by 2026, emphasizing structural reforms, productivity growth, and diversification as the principal drivers of this transformation.
Table 7 presents World Bank estimates of the number of years required for selected Eurasian economies to reach the high-income threshold, based on current structural and policy conditions. Balkan economies have been excluded for comparability within the post-Soviet and broader Eurasian region.
Table 7. Years Required to Reach High-Income Status (Selected post-soviet economies)
| Country | Years to Reach High-Income Threshold |
| Armenia | ≈20 years |
| Georgia | ≈30 years |
| Kazakhstan | ≈35 years |
| Turkmenistan | ≈35 years |
| Belarus | ≈60 years |
| Kyrgyz Republic | ≈70 years |
| Ukraine | ≈70 years |
| Azerbaijan | Over 100 years |
| Tajikistan | Over 100 years |
| Uzbekistan | Over 100 years |
In terms of macroeconomic performance, retrospective evidence indicates that during 1996–2016 Azerbaijan’s real GDP expanded at an average rate of about 10 percent per year. From 2016 through 2025, however, the pace of growth fell roughly sevenfold, to approximately 1.5% on average. Current projections suggest that 1.9% in 2025 represents the upper bound of medium-term growth under existing policies. Looking further ahead, the World Bank staff’s LTGM implies an even lower long-run trajectory and CEBR forecasts. Taken together—and absent fundamental reforms—these estimates imply that, given current rates of population increase, Azerbaijan is unlikely to converge to high-income status and may remain within the middle-income range for at least a century.
Azerbaijan’s Divergence from Regional Peers
Azerbaijan lags behind the selected comparator countries not only in terms of economic growth rates and GDP per capita, but also across a broader set of structural and institutional indicators. These include the economic freedom index (EFI),4 which reflects the degree of market liberalization; the global innovation index (GII), which captures the level of economic modernization; the corruption perception index (CPI), which serves as a proxy for the quality of governance; and the human development index (HDI), which reflects the overall level of human capital.
Taken together, these indicators suggest that the country’s challenges extend beyond macroeconomic performance to encompass deeper institutional and developmental constraints. A comparative overview of these indicators is presented in Table 8.
Table 8. Comparative Selected Institutional and Development Indicators in the South Caucasus and Kazakhstan
| Country | GII Rank | CPI Rank | Economic Freedom (Fraser Institute) | Economic Freedom (Heritage Foundation) | UN HDI Rank |
| Armenia | 59 | 65 | 57 | 57 | 69 |
| Georgia | 56 | 56 | 39 | 35 | 57 |
| Kazakhstan | 81 | 96 | 66 | 68 | 60 |
| Azerbaijan | 94 | 130 | 71 | 75 | 81 |
The data presented in Table 8 reveal a consistent pattern of Azerbaijan’s relatively weaker performance across key institutional and development indicators compared to its regional peers. In particular, Azerbaijan ranks lowest among the four countries in the Global Innovation Index (GII), indicating limited progress in innovation capacity and technological advancement. Similarly, its position in the Corruption Perceptions Index (CPI) suggests comparatively weaker governance quality and higher perceived levels of corruption.
In terms of economic freedom, Azerbaijan also underperforms relative to Georgia and Armenia, reflecting more limited progress in market liberalization and regulatory efficiency. While Kazakhstan exhibits mixed performance across indicators, it still ranks ahead of Azerbaijan in most categories.
Human Development Index (HDI) rankings further reinforce this pattern: Azerbaijan lags behind all comparator countries, indicating comparatively weaker outcomes in health, education, and living standards.
Taken together, these indicators point to structural and institutional constraints that extend beyond macroeconomic performance. They also help explain Azerbaijan’s comparatively weaker position in international assessments of political and civil liberties, suggesting that economic underperformance is closely intertwined with broader governance and institutional challenges.
Furthermore, Azerbaijan performs comparatively weaker in international assessments of political and civil liberties. According to the Bertelsmann Transformation Index (BTI) 2026,[1] which evaluates political and economic transformation in 137 countries, Georgia is classified as a “Moderate autocracy” and Armenia as a “defective democracy,” whereas Azerbaijan and Kazakhstan are categorized as a “hard-line autocracy.” In the Political Transformation Index, Armenia ranks 31th with a score of 6.90 out of 10, and Georgia ranks 76th with 4.37, Kazakhstan ranks 93rd with 3.73, while Azerbaijan ranks 106th with a score of 3.35. Similar disparities appear in the Governance Index, which assesses the capacity of political leadership to promote democracy and a market economy. Azerbaijan is classified as weak, ranking 101st with a score of 3.83, whereas Georgia (44th, 5.21) and Armenia (53rd, 5.03) are categorized as moderate performers. In terms of Economic Transformation, Azerbaijan is rated as limited, ranking 62nd with a score of 5.54.
Table 9 presents a comparative overview of the political and governance performance of Armenia, Azerbaijan, Georgia, and Kazakhstan on the basis of the selected indicators drawn from the BTI dataset. The table brings together the principal dimensions of the BTI framework, including the Status Index, Democracy Status, Political Participation, Rule of Law, Political and Economy Status, and Governance performance. By examining these indicators side by side, the table highlights both absolute differences in regime type and more specific variations in state capacity, institutional resilience, and the quality of political competition.
Table 9. BTI-Based Comparison of Democracy, Governance, and Economic Performance in Selected Post-Soviet States
| Country | Status Index Rank | Status Index | Democracy Status | Political Participation | Rule of Law | Political & Social Integration | Economy Status | Governance Index |
| ARM | 26 | 6.84 | 6.90 | 7.8 | 6.0 | 5.8 | 6.79 | 5.10 |
| AZE | 90 | 4.41 | 3.35 | 2.0 | 2.3 | 2.0 | 5.46 | 3.77 |
| GEO | 65 | 5.17 | 4.37 | 4.5 | 4.3 | 4.3 | 5.96 | 4.21 |
| KAZ | 71 | 4.94 | 3.73 | 2.3 | 3.5 | 2.7 | 6.14 | 4.42 |
As shown in Table 9, Armenia is the strongest performer among the four countries across almost all political indicators. Its democracy score of 6.90 places it in the category of defective democracies rather than autocracies. Relative strengths are visible in political participation, rule of law, and institutional stability, although its scores still suggest significant democratic imperfections rather than consolidated liberal democracy.
According to the Bertelsmann Stiftung’s Transformation Index, Azerbaijan is the weakest case politically. Despite a relatively high stateness score of 8.5, its democracy status score of 3.35 places it in the hardline autocracy category. The most striking feature is the gap between state capacity and political openness: political participation, rule of law, institutional stability, and political-social integration are all extremely low, indicating a highly centralized and restrictive political order.
Georgia occupies an intermediate but deteriorated position. It performs better than Azerbaijan and Kazakhstan on democracy-related indicators, especially political participation and rule of law, but its overall democracy status score of 4.37 places it in the moderate autocracy category. This suggests that, although formal pluralism and institutional competition remain more developed than in harder autocracies, democratic performance has weakened substantially.
Kazakhstan scores slightly above Azerbaijan and below Georgia in overall status, but its democracy status score of 3.73 also classifies it as a hardline autocracy. Like Azerbaijan, Kazakhstan combines relatively strong state structure with weak political participation and limited institutional accountability. Its somewhat better rule-of-law and governance scores suggest a more administratively functional system, but not a more democratic one.
Taken together, the table shows a clear regional hierarchy among these four cases: Armenia stands apart as the only defective democracy, Georgia has drifted into moderate autocracy, and both Azerbaijan and Kazakhstan fall into hardline autocracy. The comparison also indicates that strong state capacity does not necessarily translate into democratic governance; in both Azerbaijan and Kazakhstan, state consolidation coexists with highly restricted political freedoms and weak accountability institutions.
According to Freedom House, Azerbaijan received a score of 6 out of 100 in the Freedom in the World 2025 report, placing it firmly in the “Not Free” category. Moreover, Azerbaijan is among the countries that have experienced one of the most pronounced long-term declines in freedom globally, with its score falling from 33 to 6 over the past two decades—a total decrease of 27 points.
This negative trajectory stands in contrast to broader regional trends. Over the same period, Armenia has recorded a positive shift of +13 points, while Georgia has experienced a recent decline of −4 points in a single year and is included among the countries with the largest one-year declines in 2025.
This represents a marked deterioration from Azerbaijan’s earlier classification as “Partly Free.” By contrast, Armenia and Georgia scored 54 and 51, respectively, and are both categorized as “Partly Free.” While Azerbaijan has experienced a sustained decline in political rights and civil liberties over time, Armenia, despite some fluctuations, has maintained comparatively more stable levels of political pluralism and electoral competition since the early 2000s. Kazakhstan, by comparison, received a score of 23 and is likewise classified in the “Not Free” category, though its overall trajectory has been less steep than Azerbaijan’s.
The Economist Intelligence Unit (EIU) Democracy Index 2024 provides further evidence of this divergence. Azerbaijan is categorized as an authoritarian regime, with an overall score of 2.80 out of 10, ranking 126th globally. Kazakshtan scored 3.06 (rank 118), Georgia scored 4.70 (rank 94) and Armenia 5.35 (rank 82), placing both countries in the category of hybrid regimes.
Longitudinal data also highlight contrasting trajectories in the region. Since the first publication of the EIU Democracy Index in 2006, Azerbaijan has consistently remained within the authoritarian regime category. Its score declined from 3.31 in 2006 to 2.80 in 2024, reflecting persistent democratic stagnation and institutional consolidation of executive power. In contrast, Georgia and Armenia have remained in the hybrid regime category. While Georgia’s score declined slightly from 4.90 in 2006 to 4.70 in 2024, Armenia’s score improved from 4.15 to 5.35, particularly following the political reforms associated with the 2018 Velvet Revolution. By contrast, Kazakhstan’s score decreased from 3.62 in 2006 to 3.06 in 2024, indicating a gradual deterioration in its democratic performance. However, despite this long-term decline, Kazakhstan recorded a modest short-term improvement, rising by two positions in the global ranking compared to the previous year.
From a theoretical perspective, Azerbaijan’s trajectory illustrates the dynamics of authoritarian resilience in resource-rich states, where hydrocarbon revenues strengthen state capacity to maintain political control through patronage networks, elite consolidation, and limited political competition. By contrast, the relatively lower levels of natural resource dependence in Armenia and Georgia have created greater incentives for institutional reforms, external democratic engagement, and more competitive political systems.
Overall, comparative indicators suggest an increasing divergence in political development within the South Caucasus. While Armenia and Georgia have maintained hybrid or partially democratic systems, Azerbaijan has consolidated a centralized and durable authoritarian governance model, despite its significant economic resources.
Conclusion
A retrospective and prospective analysis of Azerbaijan’s economic development suggests that the country’s current growth model is increasingly unsustainable. Persistent structural weaknesses—particularly the mono-sectoral dependence on hydrocarbons—combined with institutional deficiencies, limited economic diversification, and constraints on economic, political, and civil liberties, significantly undermine long-term development prospects. The prevailing centralized and authoritarian governance model further constrains the emergence of competitive markets, innovation, and productivity growth.
The temporary prosperity generated by resource wealth has contributed to a degree of policy complacency, while reform efforts in diversification and liberalization have either remained limited or have not been supported by robust anti-corruption and pro-competition institutions. As a result, these measures have had little durable impact and, in some cases, have exacerbated existing vulnerabilities. In the medium to long term, such dynamics increase the risk of entrenchment in the middle-income trap, weaken socio-economic progress, and reduce policy attention to environmental sustainability and climate challenges.
Consequently, Azerbaijan is increasingly lagging behind not only resource-rich Kazakhstan—despite similarities in political and economic structures—but also resource-constrained Georgia and Armenia. The emerging divergence in development trajectories underscores the critical role of institutional quality, governance, and structural transformation in shaping long-term economic outcomes.
In this context, the comparison between victorious Azerbaijan and defeated Armenia is particularly illustrative. The current development trajectory and perspective forecasts of Azerbaijan and Armenia allows us to draw parallels with how West Germany, which was defeated in World War II, lagged behind the victorious USSR in terms of economic and social indicators, institutional and structural development, and the level of productivity and modernization in the economy. It highlights how differences in institutional reform, economic policy orientation, and governance can lead to markedly different development paths, even among countries with contrasting initial conditions and resource endowments.
References
Asian Development Bank. (2023). Azerbaijan: Country partnership strategy and economic update. ADB.
Auty, R. M. (2001). Resource abundance and economic development. Oxford University Press.
Barry Eichengreen, Donghyun Park, & Kwanho Shin (2013). “Growth Slowdowns Redux: New Evidence on the Middle-Income Trap.” NBER Working Paper No. 18673.
BTI 2026 Scores, https://bti-project.org/en/reports/regional-dashboard/CIS?&cb=00000
Center for Economic and Business Research (CEBR), A world economic league table with forecasts for 190 countries to 2040, https://cebr.com/wp-content/uploads/2025/12/WELT-2026.pdf
Das, U. S., Ahmed, M., Papaioannou, M. G., & Pescatori, A. (2022). Managing natural resource wealth. International Monetary Fund.
European Bank for Reconstruction and Development. (2024). Regional economic prospects. EBRD.
Gelb, A. (1988). Oil windfalls: Blessing or curse? Oxford University Press.
The Heritage Foundation (2025), The Index of Economic Freedom, https://static.heritage.org/index/pdf/2025/2025_indexofeconomicfreedom_highlights.pdf
UNDP, Human Development Report 2025, https://www.undp.org/jamaica/publications/human-development-report-2025
Freedom in the World (2026), The Growing Shadow of Autocracy, https://freedomhouse.org/report/freedom-world/2026/growing-shadow-autocracy
The Fraser Institute, Economic Freedom of the World 2025 Annual Report, https://www.cato.org/sites/cato.org/files/2025-09/economic-freedom-of-the-world-2025-full-issue.pdf
The Transparency International, (2025), Corruption Perceptions Index (CPI), https://www.transparency.org/en/cpi/2025
Huseynov, V., Aliyev, Z., & Mammadli, A. (2023). Assessment of Azerbaijan’s socio-economic development strategy 2022–2026. Baku Policy Center.
Iacovone, L., et al. (2025). Paths to prosperity: Long-term growth prospects in Eurasia. World Bank.
Ibadoghlu, Gubad (2026), Energy, Power, and Repression: Political Economy Insights from Azerbaijan, published by Crude Accountability, https://crudeaccountability.org/energy-power-and-repression-political-economy-insights-from-azerbaijan/
Ibadoghlu, Gubad (2025), Tourism and the Border-Closure Effect in Azerbaijan: Post-Pandemic Recovery, Structural Constraints, and Regional Competitiveness. Available at SSRN: https://ssrn.com/abstract=5700023 or http://dx.doi.org/10.2139/ssrn.5700023
Ibadoghlu, Gubad, (2024), Orthodox View on the 30th Anniversary of the Azerbaijan’s “Contract of the Century.” Available at SSRN: https://ssrn.com/abstract=4962993 or http://dx.doi.org/10.2139/ssrn.4962993
Ibadoghlu, Gubad (2018), Financial inclusion, financial literacy, and financial education in Azerbaijan, ADBI Working Paper, No. 842, Asian Development Bank Institute (ADBI), Tokyo, https://www.econstor.eu/bitstream/10419/190263/1/adbi-wp842.pdf
Ibadoghlu, Gubad & Bayramli, Emin (2024), Could the economy of Azerbaijan fall into the middle-income trap? Available at SSRN: https://ssrn.com/abstract=4870534 or http://dx.doi.org/10.2139/ssrn.4870534
Ibadoghlu, G., & Niftiyev, I. (2022a). A retrospective analysis of the Azerbaijani economy during 30 years of independence. Post-Soviet Issues, 9(3), 34–52.
Ibadoghlu, G., & Niftiyev, I. (2022b). An assessment of the thirty-year post-Soviet transition quality in Azerbaijan from an economic and social liberalization perspective. Journal of Life Economics, 9(2), 137–150.
International Monetary Fund. (2025). Republic of Azerbaijan: Staff country report. IMF, https://www.imf.org/en/news/articles/2025/04/22/pr-25118-azerbaijan-imf-concludes-2025-article-iv-consultation
The IMF (2025), Global Economy in Flux, Prospects Remain Dim, https://www.imf.org/en/Publications/WEO/Issues/2025/10/14/world-economic-outlook-october-2025?cid=bl-com-AM2025-WEOEA2025002
Moody’s Investors Service. (2025). Azerbaijan – sovereign credit outlook, https://ratings.moodys.com/ratings-news/446416
Oliver Wyman, a Marsh McLennan business (2026), Azerbaijan 3.0: The Market Makers of Tomorrow by 2035, https://www.oliverwyman.com/content/dam/oliver-wyman/v2/publications/2026/apr/azerbaijan-the-market-makers-of-tomorrow.pdf
Rookwood, D. (2021). The political economy of oil dependence in Azerbaijan. Eurasian Studies Quarterly, 12(2), 88–112.
Ross, M. L. (2012). The oil curse: How petroleum wealth shapes the development of nations. Princeton University Press.
Sachs, J. D., & Warner, A. M. (2001). The curse of natural resources. European Economic Review, 45(4–6), 827–838.
S&P Global Ratings. (2025). Azerbaijan sovereign rating report. S&P Global.
State Statistical Committee of the Republic of Azerbaijan. (2024). Macroeconomic indicators of Azerbaijan. SSC, https://www.stat.gov.az/news/macroeconomy.php?lang=az&page=15&arxiv=1
Transition Economics Two Decades On by Gerard Turley, Peter J. Luke Published 2010. ISBN-13: 978-0-203-84291-1, ISBN: 0-203-84291-X. Transition and Development
World Bank. (2022). Azerbaijan: Country economic memorandum. World Bank, https://documents1.worldbank.org/curated/en/099100009222236784/pdf/P17532606988e2056084e603c9c48ddc618.pdf
World Bank. (2023). Navigating uncertainty: Economic update for Azerbaijan. https://www.worldbank.org/en/news/press-release/2023/10/04/world-bank-fall-2023-regional-economic-updates
The World Bank (2025a), Jobs and Prosperity Office of the Chief Economist Fall 2025 Europe and Central Asia Economic Update, https://openknowledge.worldbank.org/server/api/core/bitstreams/9b18a520-9e9a-4e71-af8d-cf04b499fa18/content
World Bank. (2025b). Long-term growth model (LTGM) projections for Azerbaijan. https://www.worldbank.org/en/research/brief/LTGM
The World Bank (2025c), Accelerating Growth through Entrepreneurship, Technology Adoption, and Innovation Office of the Chief Economist Spring 2025, https://openknowledge.worldbank.org/server/api/core/bitstreams/f34d0317-f1ab-4e39-b209-c7e2c149de19/content
- Turley, Gerard, Peter J. Luke (2010). Transition Economics Two Decades On. ISBN-13: 978-0-203-84291-1, ISBN: 0-203-84291-X. ↩︎
- Ibadoghlu, Gubad (2018) : “Financial inclusion, financial literacy, and financial education in Azerbaijan.” ADBI Working Paper, No. 842, Asian Development Bank Institute (ADBI), Tokyo. ↩︎
- Barry Eichengreen, Donghyun Park, & Kwanho Shin (2013). “Growth Slowdowns Redux: New Evidence on the Middle-Income Trap.” NBER Working Paper No. 18673. ↩︎
- Kim, Anthony B (2025). “Highlights of the 2025 Index of Economic Freedom.” Heritage Foundation, https://static.heritage.org/index/pdf/2025/2025_indexofeconomicfreedom_highlights.pdf ↩︎